 |
 |
|
 |
....The Graph Editor. 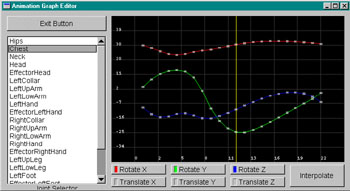 ....The graph editor is a two-dimensional graph of rotation data versus time. Located on the left of the window is a list of all of the joints available in the scene (hierarchically sorted). Located in the right portion of the window is a set of buttons used for turning on and off the display of certain curves in the main window (located above). There is also an INTERPOLATE button in the lower-right. ....Selecting Joints: ......The aforementioned window on the left allows the user to select from the available joints in the current skeleton. A single joint or multiple joints can easily be selected from the list by either single clicking or using the CTRL or SHIFT buttons to select a range. Once a joint is selected, the proper data -should- pop up in the window on the right. This, however, does not happen all the time, as I was unable to always re-initialize the main graph window. The easiest way to remedy this difficulty is to, after selecting your desired joints, click any mouse button in the window on the right. The new data will appear centered in the window once it receives scope. ....Setting Visibilities: ......The buttons on the lower right side of the graph editor serve a dual purpose. Since their button color matches the color of the curves in the main graph window, they tell the user what rotation/motion each curve represents. Their second, and main, purpose is to control the visibility of each curve. Toggling each button to the off position will remove the curve from the graph display. A simple toggle to the on position will bring the curve back into the main window for further manipulation and visualization. ....Viewing and manipulating curve data: ......The largest window in the graph editor is where the crux of the its power resides. The first thing you will notice is the vertical yellow line in the editor. This represents what time the animation is currently at, and changes according to manipulation of the time slider in the main window. Precise curve editing and time scrubbing is thusly accomplished when it comes time to tweak the motion curves. ......The second point of interest are the curves located in the window. These represent the translations and rotations of the currently selected joint. Each curve has a series of key points along it. Curve manipulation (interpolation, dragging) can only be done at these points. ......In order to do any manipulation, you must have a way to select the points. This is accomplished by dragging a selection box with the LEFT mouse button over the series of points you would like to select. The currently selected points will appear in a dark yellow color denoting their active state. You now have a choice of two things you can do to these points. Either drag them or interpolate their values from their neighbor points. If you would like to interpolate their values, simply press the INTERPOLATE button in the lower right corner of the graph editor. They will shift into new positions according to the way they should be interpolated. ......Note that there are a number of special features of the INTERPOLATE button. One is that any time you press the INTERPOLATE button, both the euler data in that range and the quaternion data are interpolated (for the selected joint only!). The quaternion data, however, is interpolated for all three (xyz) rotations in the largest selected range. So if you have selected frames 10-20 for X and only 12-18 for Y and click INTERPOLATE, the quaternion data will be interpolated for frames 10-20. Notice also that this interpolates all three (xyz) rotations for quaternions, as it makes little mathematical sense to interpolate the three seperately. The control that you get with the visible Euler angles is therefore lost with quaternion rotations. ......The second manipulation technique, dragging, is accomplished with the RIGHT mouse button. Make sure CAPS LOCK is off and, while your desired points are selected, hold the RIGHT mouse button down and drag it either up or down. This interactively resets the Euler rotational value of that joint to be at that position. Note that this does nothing to the quaternion data. Only the INTERPOLATE button affects quaternion data. Note also, that you cannot drag to the right or left. This is because the keys for the data are rigidly located at one for each frame. Absolute control can be exercised with this system though, and it therefore does not provide any hindrance to the savvy motion-editor. ......A final point of interest with the graph editor involves the data's global X,Y,Z curves. If you change, for example, the hips' rotations, the translations don't appear to change. This is not a bug, but rather a fact of rotational motion capture data. If you change the rotations for a single joint, the joints below it in the heirarchy change their locations, not the joint itself. Don't be fooled by this feature. ....The Graph Editor Camera Manipulations: ......The mouse is used extensively throughout the graph editor window. Mouse techniques for selecting and dragging points have already been mentioned, but the mouse can also be used to scale and translate the graph editor window. Make sure the CAPS LOCK key is set to the ON position, and drag the LEFT mouse button in the window. This will scale the data in the graph according to the direction you drag. Similarly, with the CAPS LOCK key turned on, drag the RIGHT mouse button to translate the data around the graph window. If, for some reason, you have gotten lost in the data or things just don't look like you would like them to look, simply click the MIDDLE mouse button (with either CAPS LOCK on or off) and all of the data will be re-centered on the screen. This is a useful button to click after selecting a joint on the left side of the screen (see refresh bug in 'Selecting Joints' section above). ..........all content copyright 2000 - Andrew Gardner and Steven Dutcher. |
|