 |
 |
|
 |
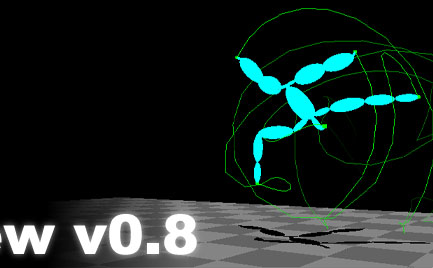
....Imagery and Explanation. ....The following is a gallery of sorts of nifty tricks and features of MoView. The pictures are intended to show off MoView's features and abilities by example. Warning, many images are quite physically large in this section - since they are in the .gif format though, they maintain a reasonable download time. ....A Graph Editor Comparision: ......There are two seperate pictures included in this one large image. One is of Maya's graph editor after we imported the data into it (via a MEL script) and the other is our graph editor before we imported the image. Do you seem any difference? There is - theirs is interpolated with splines, but I believe you would be hard-pressed to find much else that's different. IMAGE ....An Undocumented Feature: ......Honestly, I just couldn't find a place to put this feature of MotView, so I am including it here. MotView gives the user the ability to 'rip off' another window (much like the main animation window) to view and manipulate the data completely seperately from the main window. The main time slider continues to manipulate the secondary motion window, but the changes in button state will not affect the drawing state. Confused? That's what the picture's for... The window on the right was ripped off (by clicking WINDOW -> CLONE ANIMATION WINDOW) with the Euler ellipsoids and markers turned on. As you can tell, the main window now has quaternion data turned on, and as you may and/or may not be able to tell, the two animations are at the same place in time. IMAGE ....A Little Dragging: ......This image is to simply show how a little dragging of points in the graph editor can directly affect the motion in the window (it had better!). Notice that by dragging the X and Y rotations for the right shoulder, we can get the effector marker for the right shoulder (shown in green at the top of the screen) to follow a very similar rotational pattern. The identical shape is due to luck, but it highlights how the graph editor manipulates the global data. Notice that the red markers represent the data before it was manipulated. IMAGE ....Euler Versus Quaternion Interpolation: ......This series of images is a step-by-step (about 5 frames skipped between shots) sequence of an interpolation made by MotView. The green wireframe represents the quaternion interpolation solution, the red represents the Euler solution, and the blue represents the origional motion data. You will notice that the Euler and quaternion solutions are -completely- different. This, however, is a very good example of how quaternions are different than Euler angles. The Euler angles took a very roundabout way to interpolate between the two positions while, upon close inspection, the quaternions can be seen to find the shortest path between the two poses. This is neat stuff. IMAGE ..........all content copyright 2000 - Andrew Gardner and Steven Dutcher. |
|